The Dashboard is the first screen in AiX Webinars. It answers three questions across every webinar you run: who signed up to what, what happened, and what is happening right now.
Where to find it:
Open AiX Webinars and click Dashboard in the top bar.
What is happening now:
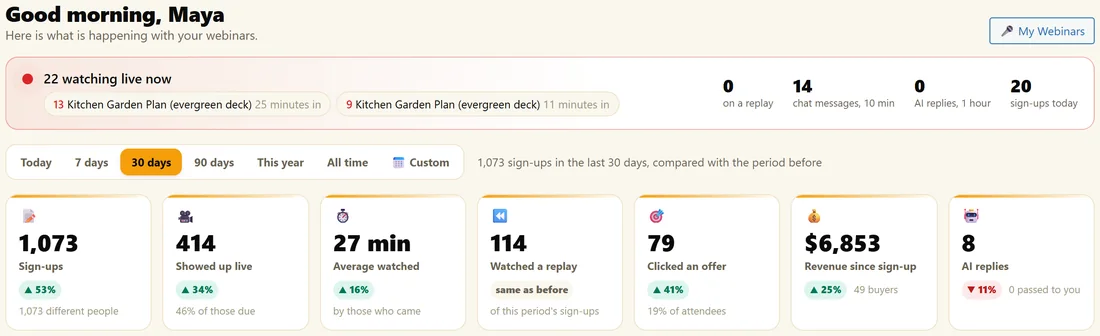
The bar at the top shows how many people are watching live, with each webinar on air and how far in it is. Beside it: people on a replay, chat messages in the last ten minutes, AI replies in the last hour and sign-ups today.
The time range:
Pick Today, 7 days, 30 days, 90 days, This year, All time or Custom. Every card and chart below follows the range, and each card shows the change against the period before.
The cards:
- Sign-ups, and how many different people that is
- Showed up live, with the share of those whose session was due
- Average watched, by those who came
- Watched a replay
- Clicked an offer, with the share of attendees
- Revenue since sign-up, when ResultsAiX Mailer is active on the same site and records your sales
- AI replies, and how many were passed to you
The charts:
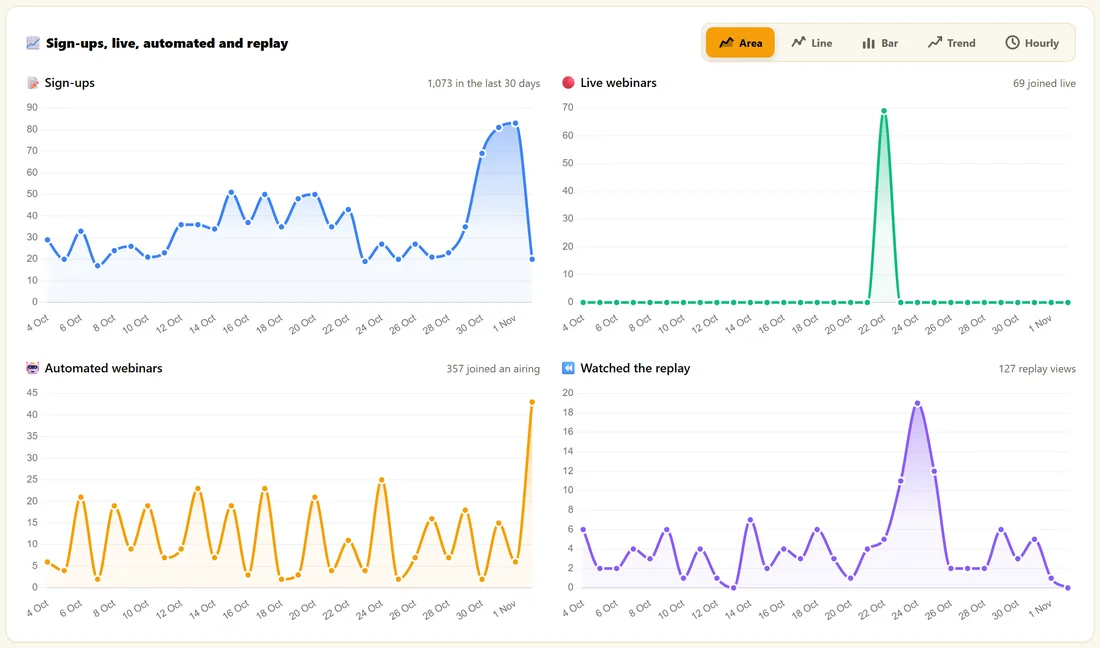
Sign-ups, live, automated and replay are drawn side by side. Switch between Area, Line, Bar and Trend, or Hourly to see the time of day people sign up.
From sign-up to sale:
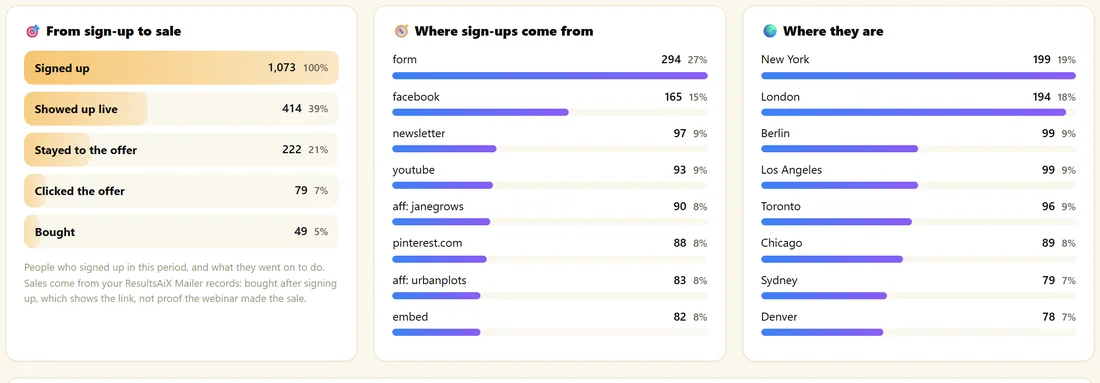
This funnel follows the people who signed up in the period: signed up, showed up live, stayed to the offer, clicked the offer, and bought when sales are recorded. Beside it, Where sign-ups come from lists sources and campaigns, and Where they are lists the cities taken from each person's time zone.
Your webinars in this period:
One row per webinar: sign-ups, showed up, show rate, average watched, replays, offer clicks and revenue, with an Analytics button that opens that webinar's own report.
Happening now and coming up:
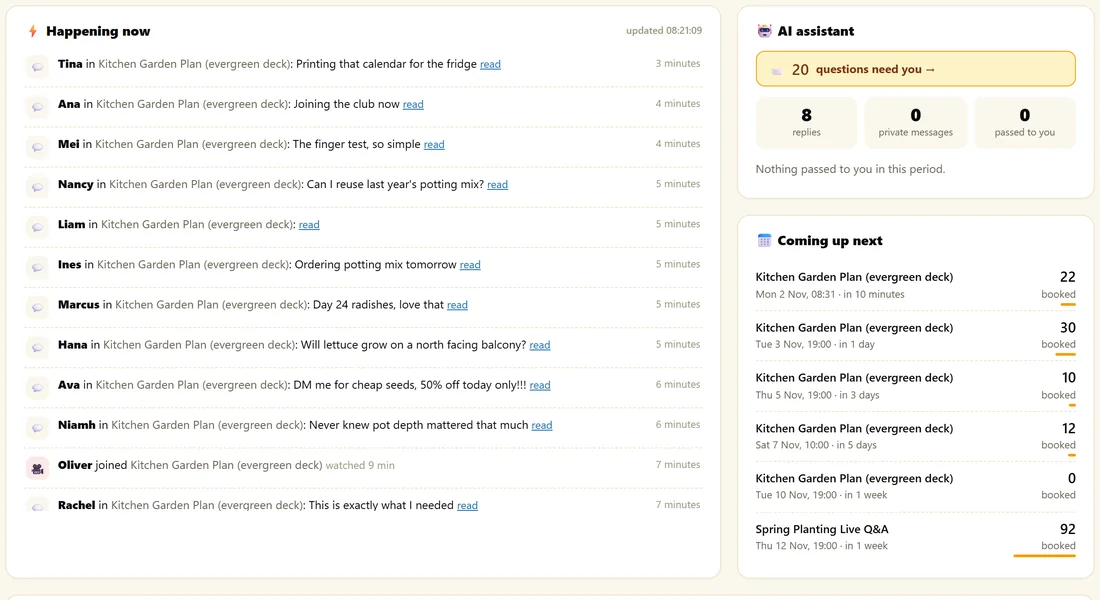
The Happening now feed lists sign-ups, chat messages and offer clicks as they happen, with a read link to the conversation. The AI assistant card shows questions that need you, and Coming up next lists the next sessions with how many are booked.
Who signed up to what:
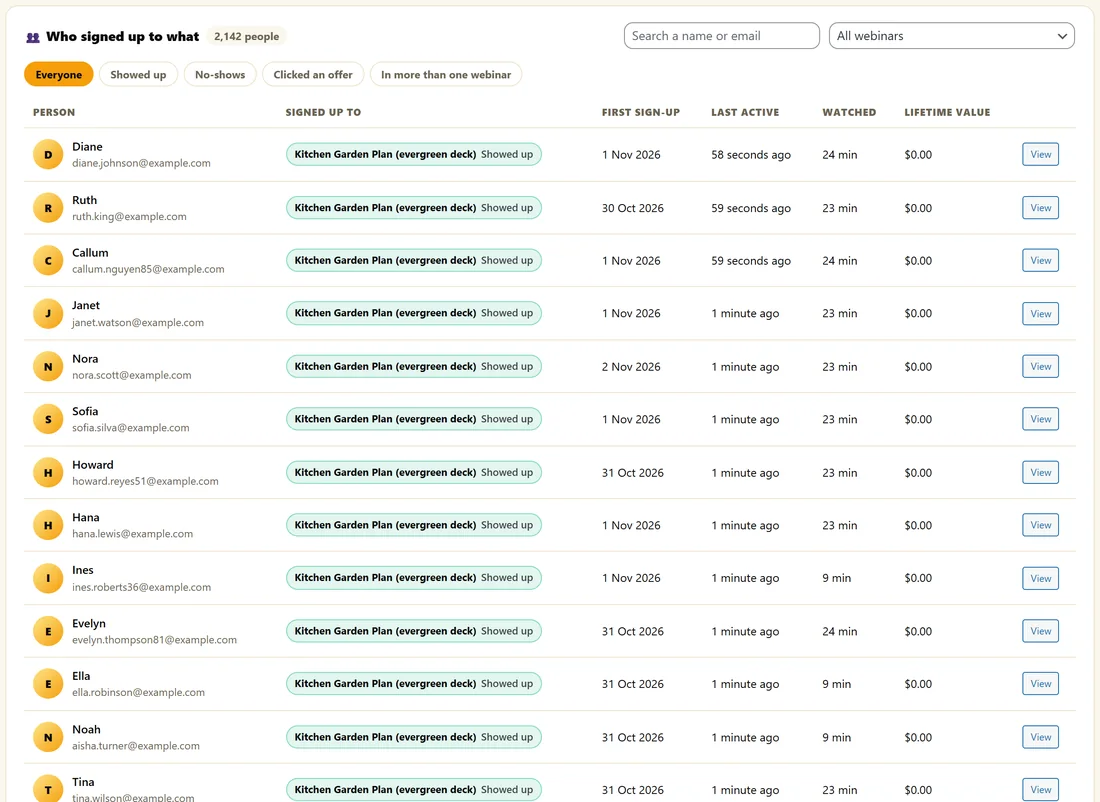
A list of every person with the webinars they signed up to, when, when they were last active, how long they watched and their lifetime value when sales are recorded. Search by name or email, pick a webinar, or filter to Showed up, No-shows, Clicked an offer or In more than one webinar. Click View for a person's full timeline.
A real example:
On Monday morning Maya opens the Dashboard on 30 days. She sees 1,153 sign-ups, 442 showed up live and 86 offer clicks. The funnel shows most people leave between showing up and the offer, so she opens the Kitchen Garden Plan Analytics to find the exact minute.
Tips:
- The live bar and feed refresh by themselves while the screen is open.
- For one webinar in depth, use its Analytics tab. See Analytics And CSV Export.
Reading the cards well:
- Showed up live counts people whose session has already happened, so a big batch of sign-ups for next week does not pull your show-up share down.
- Average watched only counts people who came, so it tells you how gripping the content is.
- Watched a replay counts this period's sign-ups who opened the replay.
- The arrow under each card compares with the period of the same length before it.
A weekly routine:
- Every Monday, open the Dashboard on 7 days.
- Look at Showed up live. If it dipped, check that the reminders are on and look at your session times.
- Look at Clicked an offer. If it dipped, open the webinar's Analytics and its minute by minute chart.
- Open Who signed up to what with Clicked an offer selected, and follow up personally with anyone who clicked but did not buy.
- Check the AI assistant card for questions that need you.
Following one person:
Click View on any row of Who signed up to what. The timeline shows every sign-up, every session they joined live, how long they watched, replays, offer clicks and purchases in order. It is the quickest way to answer "did this person attend?" from a support email.
Filtering people:
- Everyone shows the whole list
- Showed up shows people who came live
- No-shows shows people who missed their session
- Clicked an offer shows people who reached for the button
- In more than one webinar shows your most engaged people
Choose a webinar from the menu to narrow any of these to one webinar.
Custom dates:
Click Custom and choose a start and end date to compare launches, for example the week of a promotion against the week before.
A real example, continued:
Maya picks Custom for the week of her spring promotion. Sign-ups are up, and Where sign-ups come from shows facebook with campaign spring-salad as the top source. She switches the range to 90 days to compare it with her newsletter.
What to do next:
- Analytics And CSV Export for one webinar in depth
- The Leads Log And Your Webinar Library for the raw list of registrations
Common questions:
Why does revenue not show?
Revenue appears when ResultsAiX Mailer is active on the same site and records your sales. Every other card works without it.
Do test sign-ups count?
Sign-ups from the Live preview never count, because the form is switched off there. A real sign-up you make yourself counts like any other.