The heatmap viewer opens any page's heatmap right inside your dashboard, with the page on the right and everything it shows listed on the left. It also marks the clicks that go nowhere, so you can see where visitors get stuck.
Where to find it:
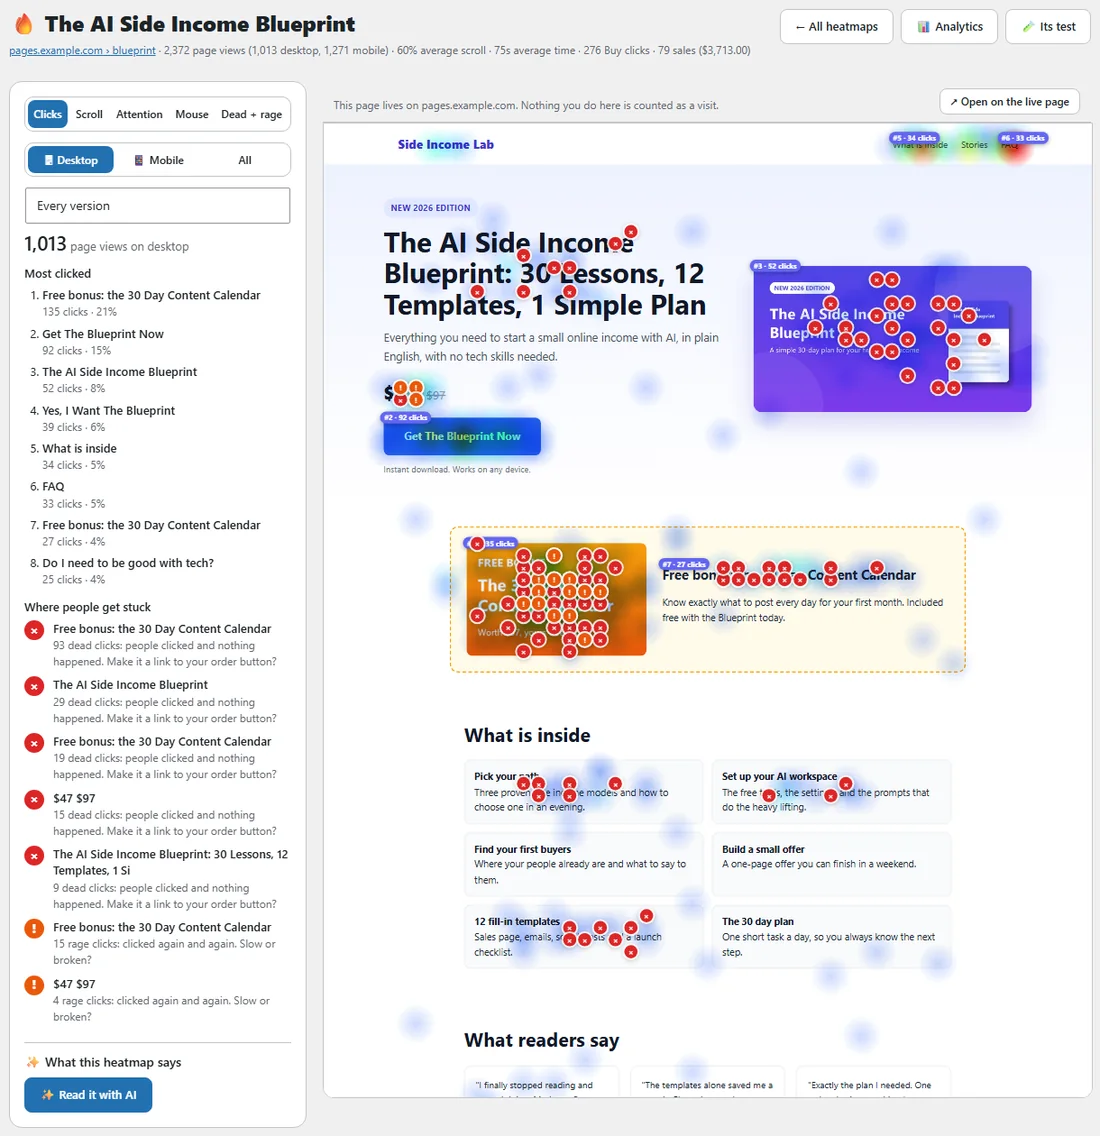
AiX Optimize, Heatmaps, then View heatmap on a page card. Analytics has a Heatmap button on every page row too.
The top line:
The page title and address, the page views (desktop and mobile apart), the average scroll and time, and the Buy clicks and sales when there are some. The buttons lead to All heatmaps, the page's Analytics, and Its test, or Test this page when no test runs on it.
The five views:
- Clicks: where people click, with the most clicked elements ranked by number.
- Scroll: coloured bands with the share of visitors who reached each point of the page.
- Attention: bands weighted by the seconds visitors spent with each part on screen.
- Mouse: where the mouse moves on desktop.
- Dead + rage: markers for dead clicks and rage clicks.
Desktop, Mobile and All:

The viewer opens on Desktop. Mobile shows phone visitors on their own, at phone width. All puts everyone together. Phone and computer visitors often use a page very differently, so look at both before you change anything.
One version of a test:
When a test runs on the page, a box lets you pick Every version or one version, so you can see why a version wins.
The side panel:
- The page views the map is drawn from.
- Most clicked: the top eight elements by name, with their clicks and their share of all clicks.
- Where people get stuck: the elements with the most dead clicks and rage clicks.
Dead clicks and rage clicks:
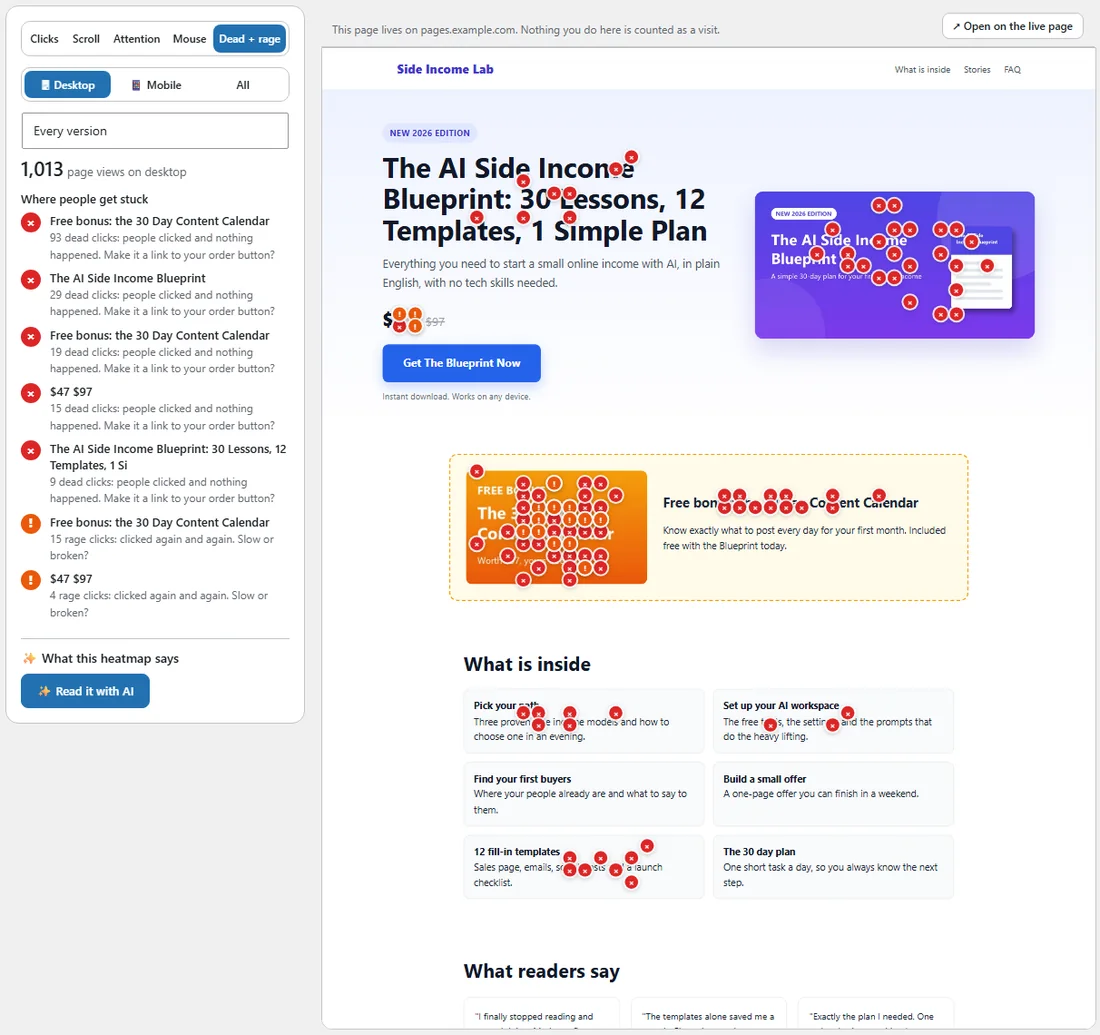
- A dead click is a click on something that is not a link or a button, after which nothing on the page changed. Red markers show them. They usually mean people expected that thing to do something, such as a bonus picture they want to click.
- A rage click is three or more quick clicks in the same spot. Orange markers show them. They point to something slow, or something that does not do what people expect.
Hover a marker to see how many clicks it stands for. When a page has none of either, the panel says nothing frustrating was found.
Pages on other sites:
A page on another of your sites opens in the viewer the same way, through a signed link that only works for you and lasts two hours. The note above the page names the site it lives on. Nothing you do in the viewer is counted as a visit.
Open on the live page:
Open on the live page shows the same heatmap over the real page in a new tab, with a bar at the top to switch views and devices. Use it for a site that does not allow its pages to be shown inside another page: the heatmap works there the same way.
What this heatmap says:
With an AI key connected, Read it with AI reads the heatmap and lists what it shows, with the numbers and a fix for each finding, plus two or three tests to run. Each test has a Build this test button. See Building A Test With AI And The Other AI Readers.
A real example:
The heatmap of The AI Side Income Blueprint on pages.example.com has 1,013 desktop page views. The most clicked element is not the Buy button but the free bonus, the 30 Day Content Calendar, with 135 clicks. Where people get stuck lists the same bonus picture with 93 dead clicks: visitors want to click it. The owner pressed Build this test to try a version that puts the bonus in the Buy button.
Tips:
- Open Dead + rage on every money page first. Each marker is a quick fix or a test idea.
- Check Mobile on its own. On many sales pages most visitors are on phones.
- Wait for a few hundred page views before you act on a heatmap.